There’s a very valid concern in the last couple weeks that all this stimulus money being pumped into the economy will cause runaway inflation ahead.
If that’s you and you just want the punchline to where you may want your money should you fear inflation, spend a minute on this chart showing how different assets have fared over about the last 50 years once I net inflation out of each of them:
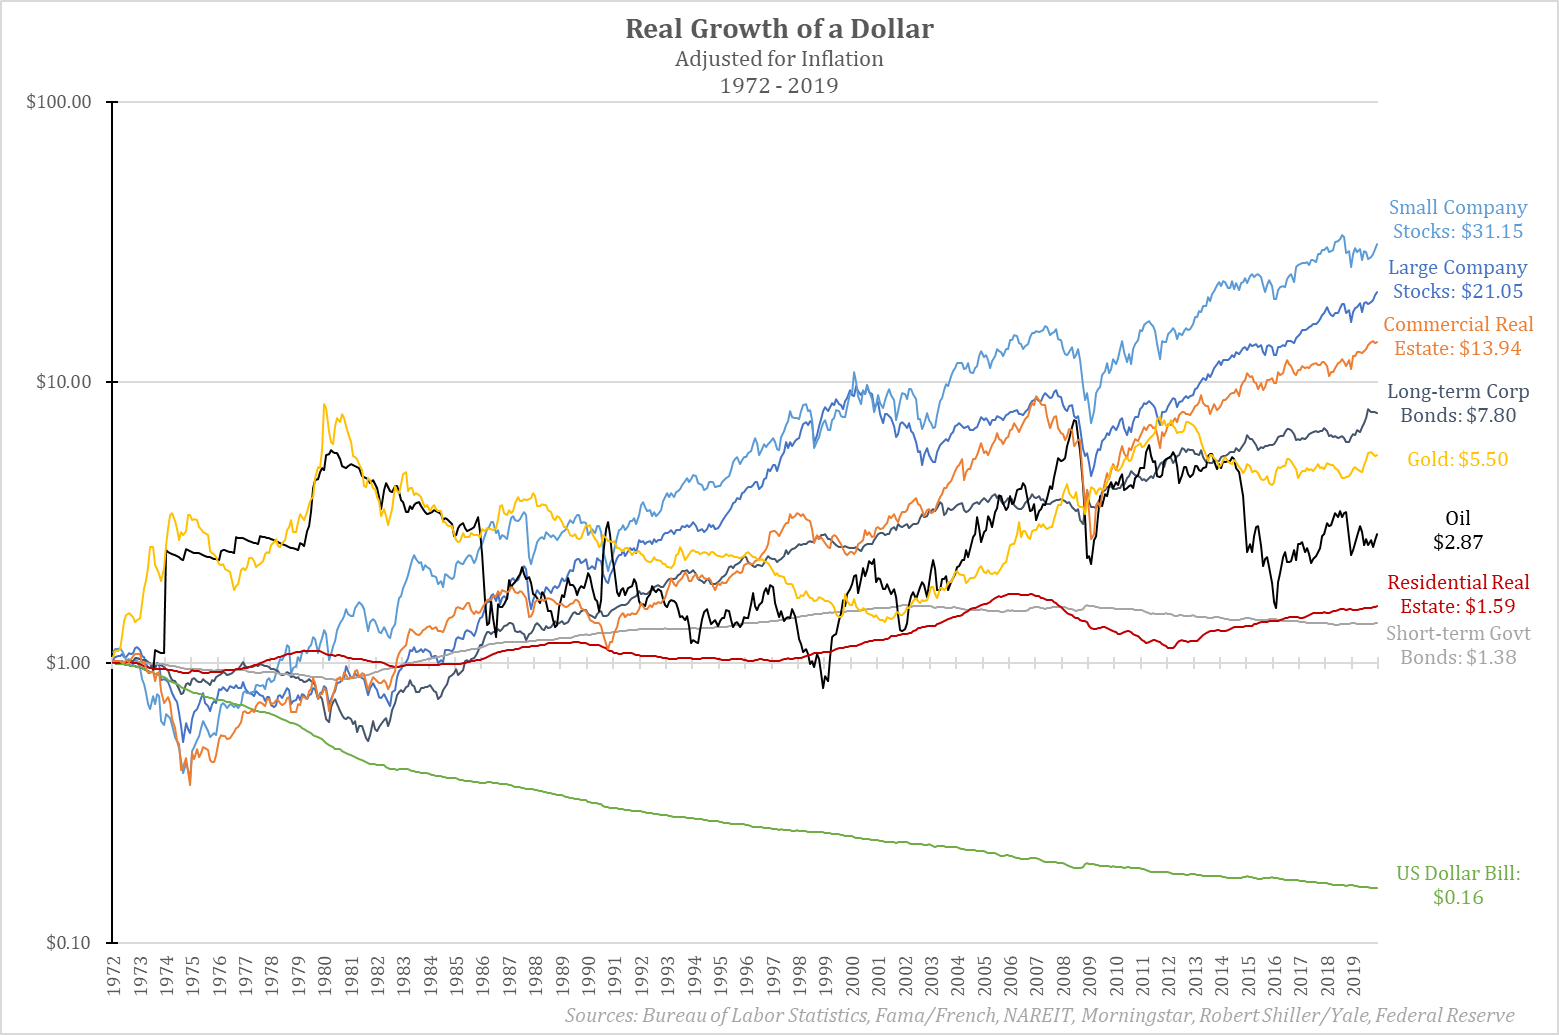
Every time I update this chart (and it takes a bit – there’s something like 16,000 data points in here and growing), I still sit and stare at it for a while. It’s fascinating data. A couple points:
- The scale on the left is logarithmic. Look at the terminal dollar amounts on the right for better comparison. Small company stocks returned 6x what gold did; large company stocks returned almost 7x what oil did. Corporate bonds returned 5x what government bonds did, and so on.
- Residential real estate is defined as our personal-use housing. Commercial real estate contains anything I rent or lease out to others and earn money from (anything from office buildings to farmland to retail space to apartment complexes and so on). I don’t earn any money from my personal home, but I do get a nice place to live, which is important.
- Though I can get data back to the 1900’s on some of these, others – like commercial real estate – are harder to get reliable data for prior to the 1970’s. Works out well in this case though as the last bout of nasty inflation the US has gone through started in 1972, which this data picks up, as well as the US abandoning the gold standard in 1971.
- And yes, you’re reading that correctly: a dollar bill then, left in cash under the proverbial mattress, is worth $0.16 today. Behold, the destructive power of inflation.
The punchline? If you fear inflation, the last thing you want to be holding are dollar bills. Pretty much anything else will work, some better than others.
What then, specifically, causes inflation? What’s the root cause?
The last time the United States has dealt with any kind of serious inflation was during the 1970’s and early 1980’s. Oil embargoes, price controls, and politically motivated, sloppy monetary policy pushed inflation to 12-15% for a period of time:
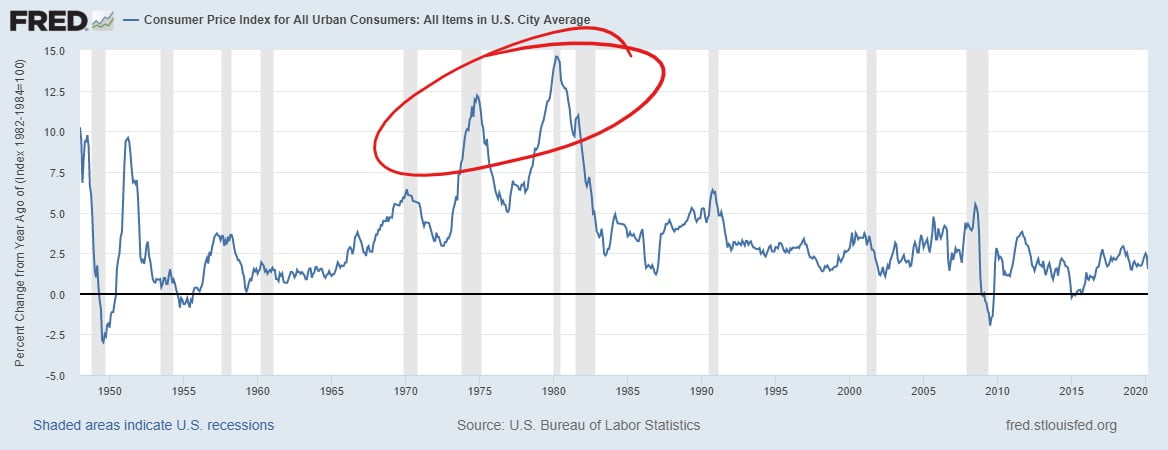
Those were perhaps our darkest days from a monetary policy perspective. We learned some very hard lessons then.
When I take that same inflation data and overlay the Federal Funds Rate (the base interest rate in our economy every other interest rate piggybacks off), you see an interesting relationship:
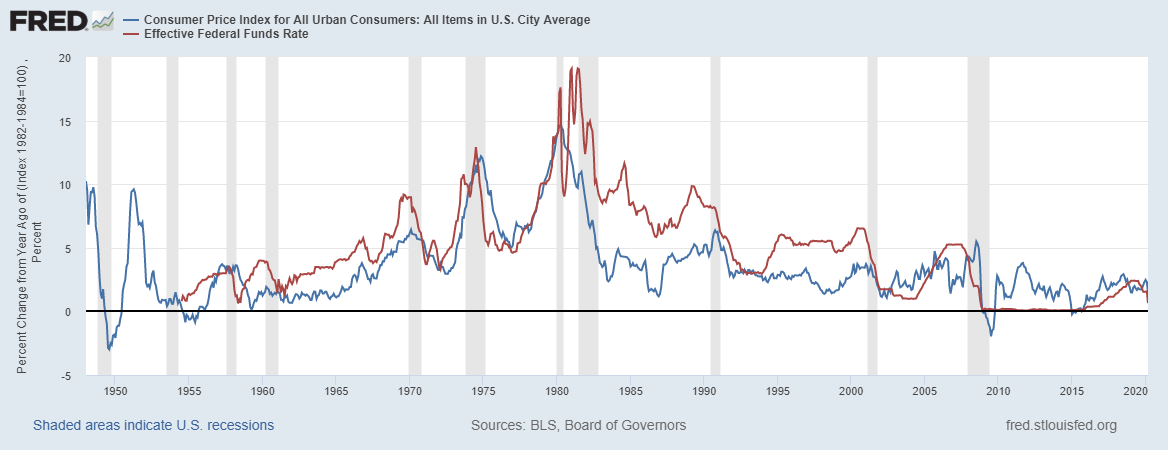
It initially appears that when you have high interest rates, you have high inflation, and when you have low interest rates, you have low inflation. But that’s not quite right.
They don’t move lockstep with each other, one actually leads in front of the other. But notice I didn’t say one causes the other; I just said one comes before the other. More on that in a minute.
Back to where interest rates come from. The Federal Reserve sets interest rates not by writing some magic number on a whiteboard somewhere, but rather with their Open Market Operations. Essentially, the Federal Reserve periodically heads into the open market, checkbook in hand, and starts buying things, primarily bonds.
I’ll cover how the Federal Reserve works in another newsletter sometime as it’s way more nuanced than this, but here’s a simple representation for now:
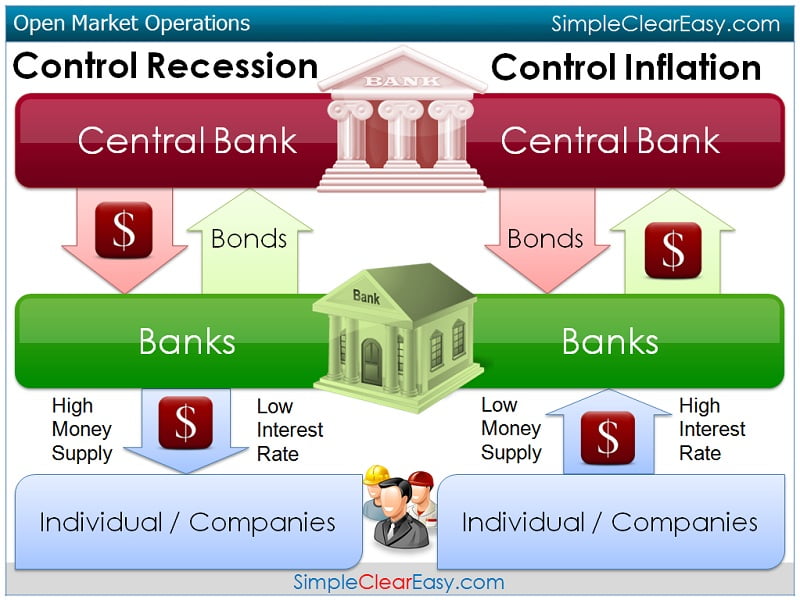
The basic logic is:
- In the face of a recession, the Federal Reserve pushes money into the system to increase money supply, which:
- Lowers interest rates, which:
- Encourages people to spend, which:
- Fuels expansionary growth and eventually inflation, which:
- Prompts the Federal Reserve to pull money out of the system and decrease the money supply, which:
- Raises interest rates, which:
- Discourages people to spend, which:
- Cools off the economy and controls inflation.
So back to this chart:
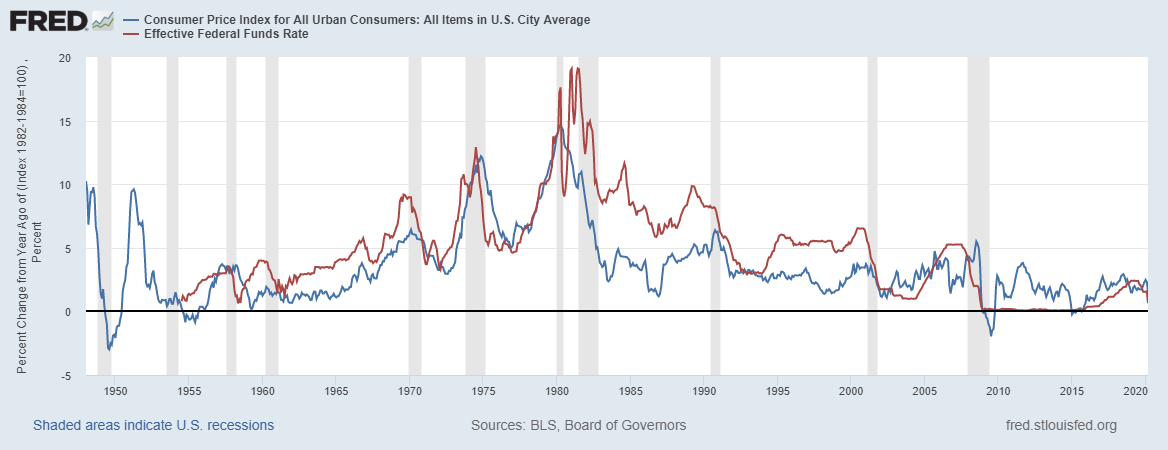
It’s not that they coincide with each other, but rather, one creates an environment for the other. Trace the red line above and watch what happens to the blue line thereafter: when the Fed brings interest rates (red line) down, it creates an environment where inflation (blue line) comes up. When inflation runs high, the Fed raises rates, bringing inflation back in check.
So hence, the argument why “cheap and easy money” leads to runaway inflation, like we’re supposedly about to have now that the Fed just pushed the gas pedal to the floor:
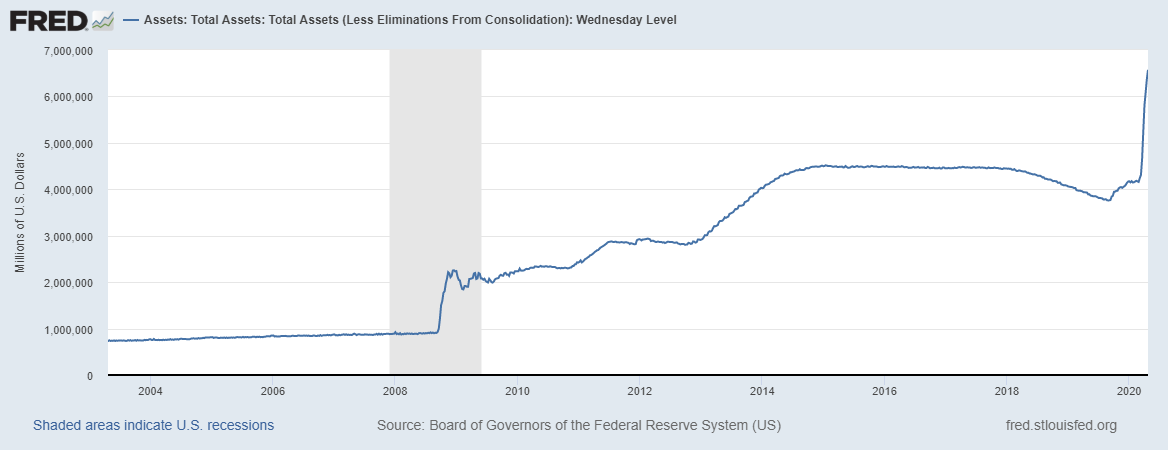
You’ve heard of the ever-expanding balance sheet of the Federal Reserve? There it is, current as of this last Wednesday. That large spike on the far right? That’s the Federal Reserve spending $2.5 trillion, which is separate from Congress’s $2 trillion dollar stimulus package:
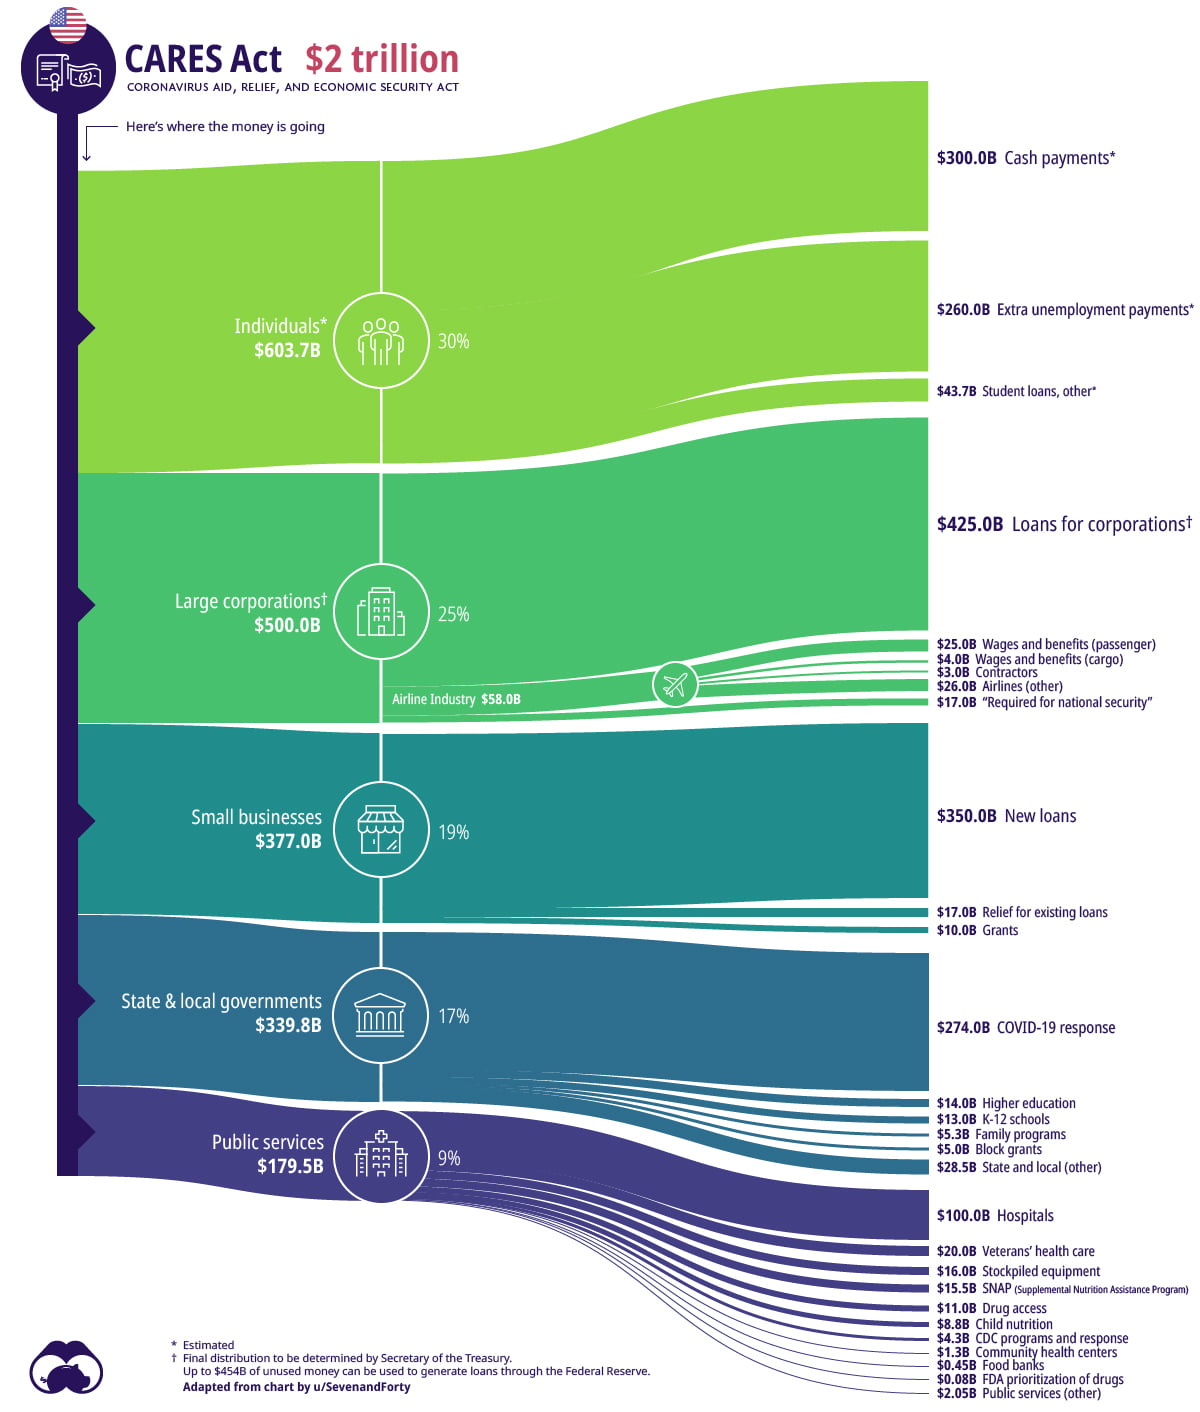
Whoa. That’s a lot of money that just came into the system. Hence, the grave concern for inflation ahead.
Sounds reasonable, except that’s not quite right either. As I mentioned earlier, high money supply comes before inflation, but high money supply doesn’t necessarily cause inflation. It may enable it, but it doesn’t cause it, and that’s where the “Printing Money = Inflation Ahead” relationship breaks down a bit.
Because there’s one element in this equation that the Federal Reserve, nor Congress for that matter, can control: the human element.
There’s only one element that causes inflation, and that’s a person stepping up to purchase something – anything – and being willing to pay more for it than the person before. Cars, houses, electronics, groceries, gasoline, you name it, it doesn’t matter. If there is no customer desire (economists call this demand) for a certain product, there will be no inflation. Look at current oil and gas prices, for example. No desire. No demand. No inflation. When was the last time you filled up your car this cheap? (Fascinating illustration here, by the way, on why oil went ‘negative’ this week)
Use yourself as an example for a minute. Let’s say you’re considering a high-dollar purchase, like a car. If you want it, but you don’t have the cash to pay for it, and the bank will only loan you the money at 20% interest, are you going to buy it? Probably not. As much as you want the new car, you’re not paying 20% interest to get it.
Now flip that script. Let’s say the Fed lowers rates and now that car loan is available at 2% interest. Are you going to go get it now? Probably.
Let’s flip it again. Let’s say after purchasing the 2% car, you can buy a 2nd, 3rd, and 4th identical car all at 0% interest. Would you do it? Meh. Your desire/demand was satisfied with the first car; a 2nd, 3rd, or 4th car will probably only sit in the driveway and depreciate away. Money is cheap, but there’s no real demand.
Let’s go back to both the Fed and Congress and their money printing.
The Federal Reserve can pump as much money into the economy as they like. As we talked about earlier, they do this by ‘giving’ cheap and easy money to the banks in the hopes they lend it out. But these large money-center banks (Wells Fargo, JP Morgan Chase, Bank of America, Citibank, and all the other banks in the Federal Reserve system) are all private, for-profit entities. If they don’t want to make a loan because it’s not a good loan, they’re not going to.
Don’t believe me? Let’s go back to 2008 and Quantitative Easing, the last time the Fed ‘printed’ a bunch of money:
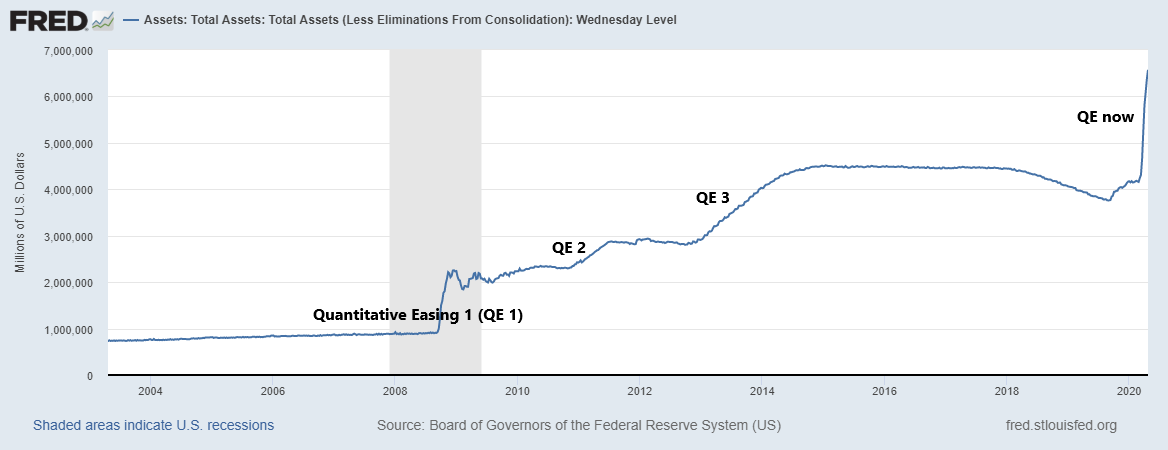
They doubled the amount of money in the banking system almost overnight and had quadrupled it by the time quantitative easing was done. That’s a lot of money. There must have been unbelievable runaway inflation during this time, right? Nope:
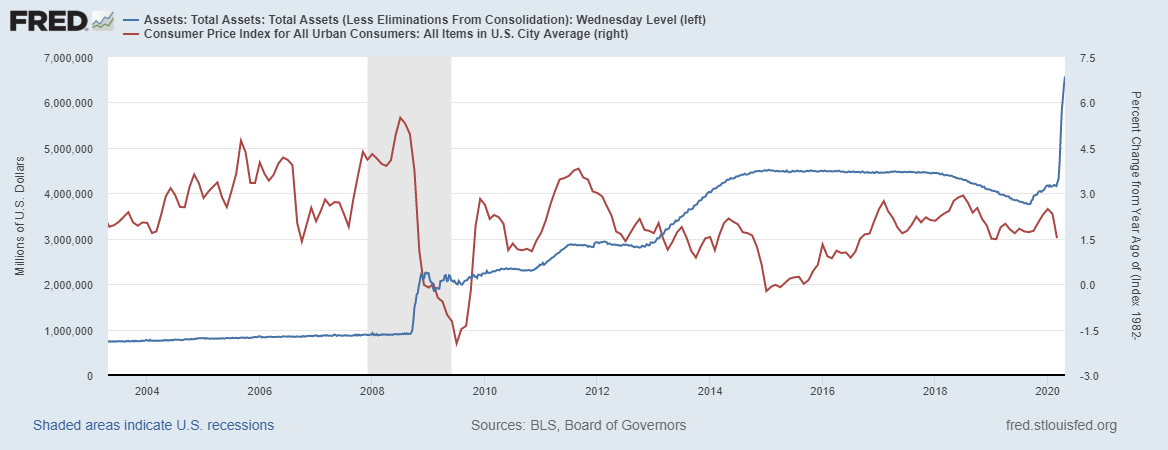
(left-scale, blue line shows Fed balance sheet increasing 4x; right-scale, red line shows inflation essentially flat over the same time)
Wait, what? Why not?
Because the Fed can give the banks all the money they want, but they can’t force them to make bad loans with it. It’s like pushing on a rope.
We know the Fed, via some form or other, pushed $3 trillion of ‘cheap and easy money’ into the system during the last recession. Yet, here’s what happened to the actual money in circulation during that same time period:
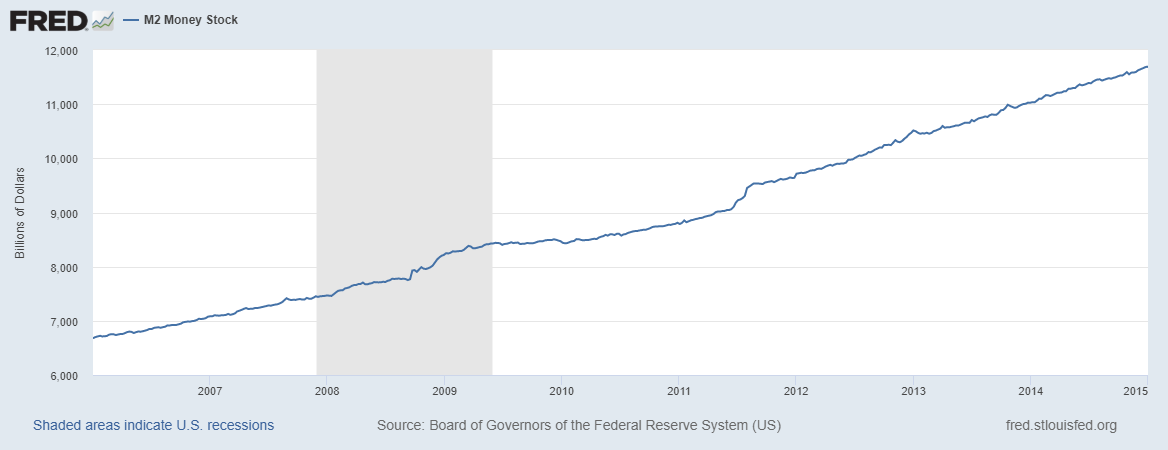
No real change. The Fed increased money supply by some 300%+, yet the actual money supply in the end economy only went up by 10% or so over the same period.
Wait. Where did that money go? What did the banks do with it?
It was certainly available for loan, but because (a) folks were a little gun-shy about loading up on new debt coming out of 2008/2009 recession (no demand, again), and (b) many loans applied for were bad loans to start with, the banks turned right around and deposited the extra cash in their ‘savings’ account at the Federal Reserve (called excess reserves, or reserves in excess of their required amounts) until the Fed eventually asked for it back:
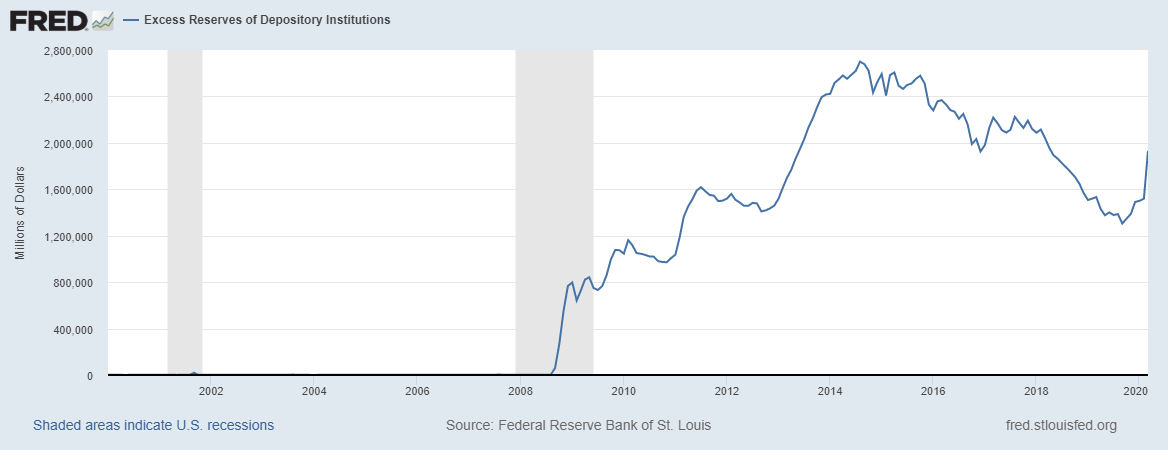
Let me lay these two charts over each other and it’s even easier to see where all the money went:
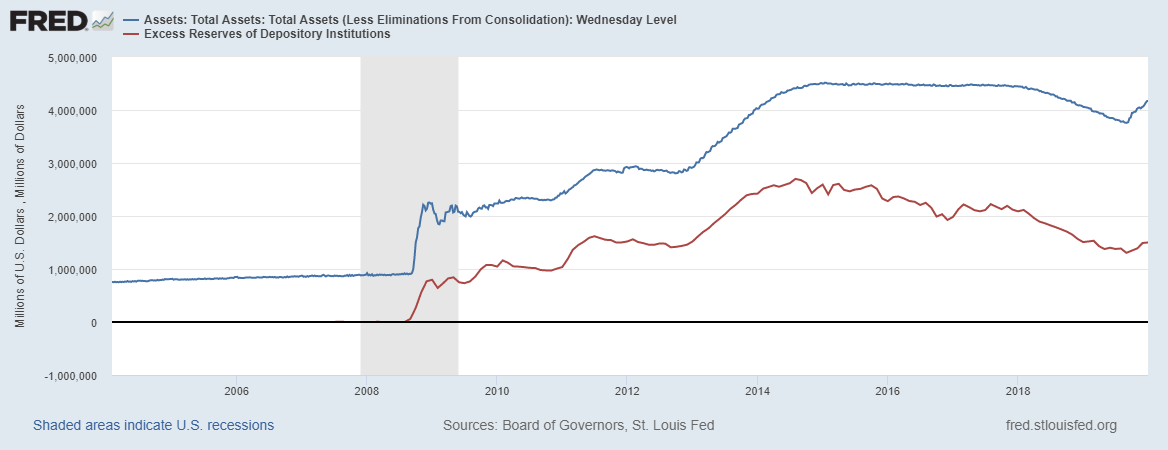
It was a no-brainer trade. The Fed pushed money to the private banks at effectively 0% interest, but because of weak consumer loan demand, the banks simply turned around and put it on deposit in their savings account at the Fed at 0.25% interest. Earning 0.25% doesn’t sound like much, but on a balance of $2.8 trillion, that’s a cool $7 billion in interest per year, with zero risk. I’d take that.
When the Fed called those loans back, the banks just had them take it out of their savings account.
That was then. This is now. When I expand the chart above to include this last couple weeks since this new stimulus:
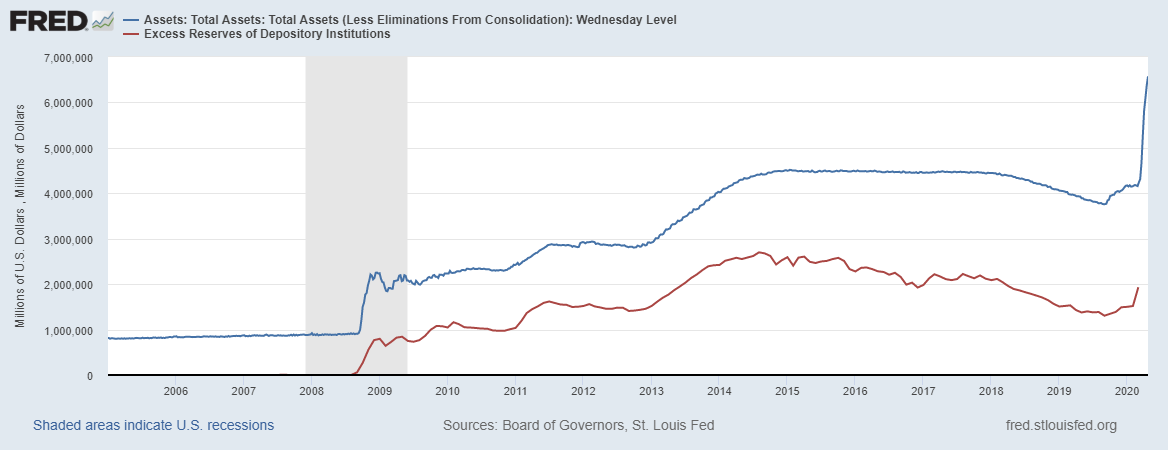
I see a pattern here.
Again, the Fed can push all the money they want into the system, but until there is end-customer desire/demand, there will be no inflation.
Here’s an easier example from the current virus fiasco. If Congress offered you a $1,000 voucher today to buy you an airline ticket to New York City for tomorrow, plus all the MTA subway rides you need, would you take it right now? Not many would. No desire. No demand. No inflation. Airline travel will be cheap for a while until consumer demand/desire returns.
Let me summarize it this way:
- Every time we’ve had inflation, we’ve had easy money.
- But every time we’ve had easy money, we haven’t had inflation.
“Yeah, Joel, but just you wait, this time is different…it’s coming!” I don’t know the future any more than you do, but let’s head over to the live market to see what people much smarter than me and with much deeper pockets than me think about inflation ahead.
Pull up any current rates table, and you can see current rates for two different types of US Treasuries:
- Regular US Treasuries: just what they sound like – regular boring bonds issued by the US Government in standard 2 year, 5 year, 10 year, and 30 year versions. I loan my money to the US government, and they pay me back with interest over the next several years.
- Treasury Inflation Protected Securities: a new version of US Treasuries, indexed to inflation to ensure investors’ money always keeps pace with inflation. As inflation rises, TIPS adjust in price to maintain its real value.
In other words, those are almost identical securities – same issuer (US Govt), same credit rating, same term length – the only difference being one has an inflation adjustment and one does not. Therefore, the only difference in price between the two should be whatever an investor thinks inflation will be over that time period. And it’s important to note these prices are set in a free-market bid/ask auction by private investors, and not set by the government, so this is truly a reflection of free-market inflation expectations.
When I compare the two yields side by side according to term length, the difference between the two gives me implied inflation over that time period:
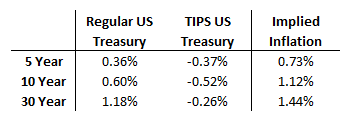
Again, these are set by the free-market; half the folks invested are more pessimistic on inflation, half are more optimistic. The market price is the equilibrium price between the optimists and the pessimists.
You don’t need to believe me. If you think you’re smarter than investors the world over who have placed a trillion dollars on the line (literally, the Federal debt is at $23 trillion, most all of which is owned by external investors), than I encourage you to follow your convictions and place a trade against them accordingly. Let me know how that turns out.
One more.
The Fed made a fundamental change to their public policy in the early ‘90’s, wherein they specifically started ‘targeting’ inflation. Targeting inflation simply means they repeatedly, publicly promote their dual-mandate of balancing unemployment and inflation, as the two tend to go opposite of each other.
When unemployment is low and everyone is working and earning, spending picks up and inflation starts to run. As the economy retracts and folks get laid-off, spending comes down and so does inflation (like right now).
The Fed has made it very clear from the early ‘90’s that they want unemployment around 5%, and inflation around 2%. Here is the inflation chart again, with a line showing when they started targeting inflation:
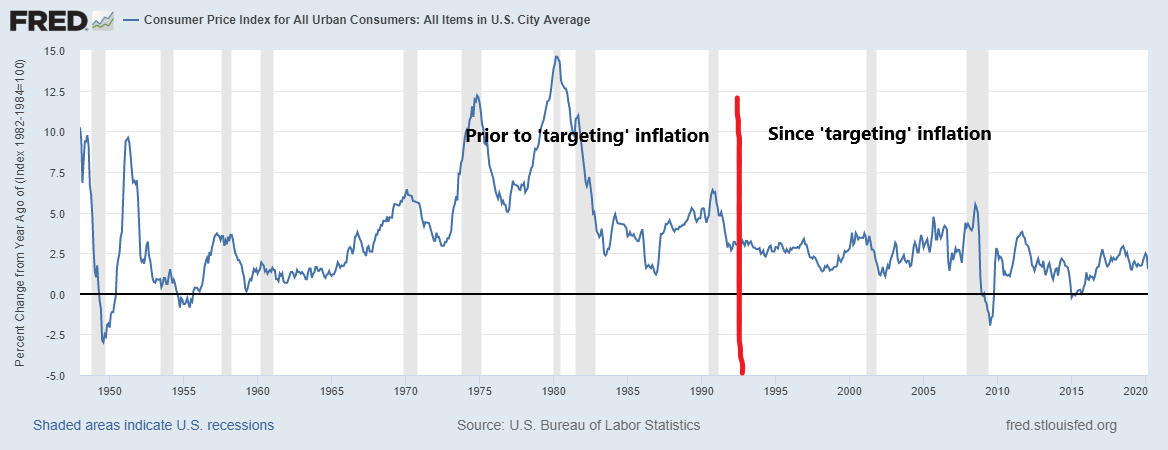
Notice how much more consistent it’s been since then? Inflation is one the Fed’s two primary targets. It’s not likely to deviate much from that 2% number without the Fed taking massive action in the opposite direction.
As an aside, notice how many recessions we’ve had (gray vertical bars in the chart above) since then compared to prior? We’re simply getting better and better at managing our economic cycles.
Demand will eventually return, and inflation will pick up. The Fed has an embedded safety valve for that. I’ll cover it in the “How the Federal Reserve Works” newsletter in the future.
Congress just pushed $2 trillion into the economy. Our annual GDP prior to this was a little over $20 trillion. If our economy declines by 10% as a result of this virus-caused contraction, then the $2 trillion basically replaces what was lost and we’re back to where we were.
I’m waaayyy more concerned about how we’re going to pay for that $2 trillion dollar stimulus, but I’ll cover that next week.
But that’s enough of hard things for a bit. Go enjoy what should be a beautiful spring weekend,

